import pandas as pd
import matplotlib.pyplot as plt
from palettable.cartocolors.diverging import Tropic_7
import os
import sys
import mplcyberpunk

plt.style.use("cyberpunk")
K-means Clustering
K-means clustering is a type of unsupervised learning, which is used when you have unlabeled data (i.e., data without defined categories or groups). The goal of this algorithm is to find groups in the data, with the number of groups represented by the variable \(K\). The algorithm works iteratively to assign each data point to one of \(K\) groups based on the features that are provided. Data points are clustered based on feature similarity.
Any new data point is assigned to the cluster with the nearest mean. The algorithm works as follows:
- Guess the number of clusters \(K\).
- Randomly pick \(K\) random points (not necessarily data points) as cluster centers called centroids.
- Repeat the following until the algorithm converges for each point
- assign it to the nearest centroid based on the Euclidean distance.
- calculate the new centroid of each cluster.
- The algorithm converges when the assignment of data points to clusters no longer changes (results stabilize).
The algorithm is sensitive to the initial random selection of centroids. To overcome this, the algorithm is run multiple times with different initializations. The final model is selected based on the sum of squared error (SSE), which is the sum of the squared distance between each member of the cluster and its centroid.
Example
Suppose in a bank, there are many transactions, we would like to identify money laundering. We can use K-means clustering to group the transactions into two groups: legitimate and money laundering. The algorithm will find the groups based on the features provided, such as the amount of money, the location of the transaction, and the type of transaction. The algorithm will then assign each transaction to one of the two groups based on the similarity of the features.
Another example is in the field of marketing, where we can use K-means clustering to group customers based on their purchases. The algorithm will find groups of customers with similar purchase histories. We can then use this information to target specific groups of customers with marketing campaigns.
For easier access to the data, we will use the built-in dataset in the sklearn library, which is the famous Iris dataset. The Iris dataset consists of 150 samples of iris flowers, each with four features (sepal length, sepal width, petal length, and petal width). The goal is to cluster the flowers into three groups based on these features.
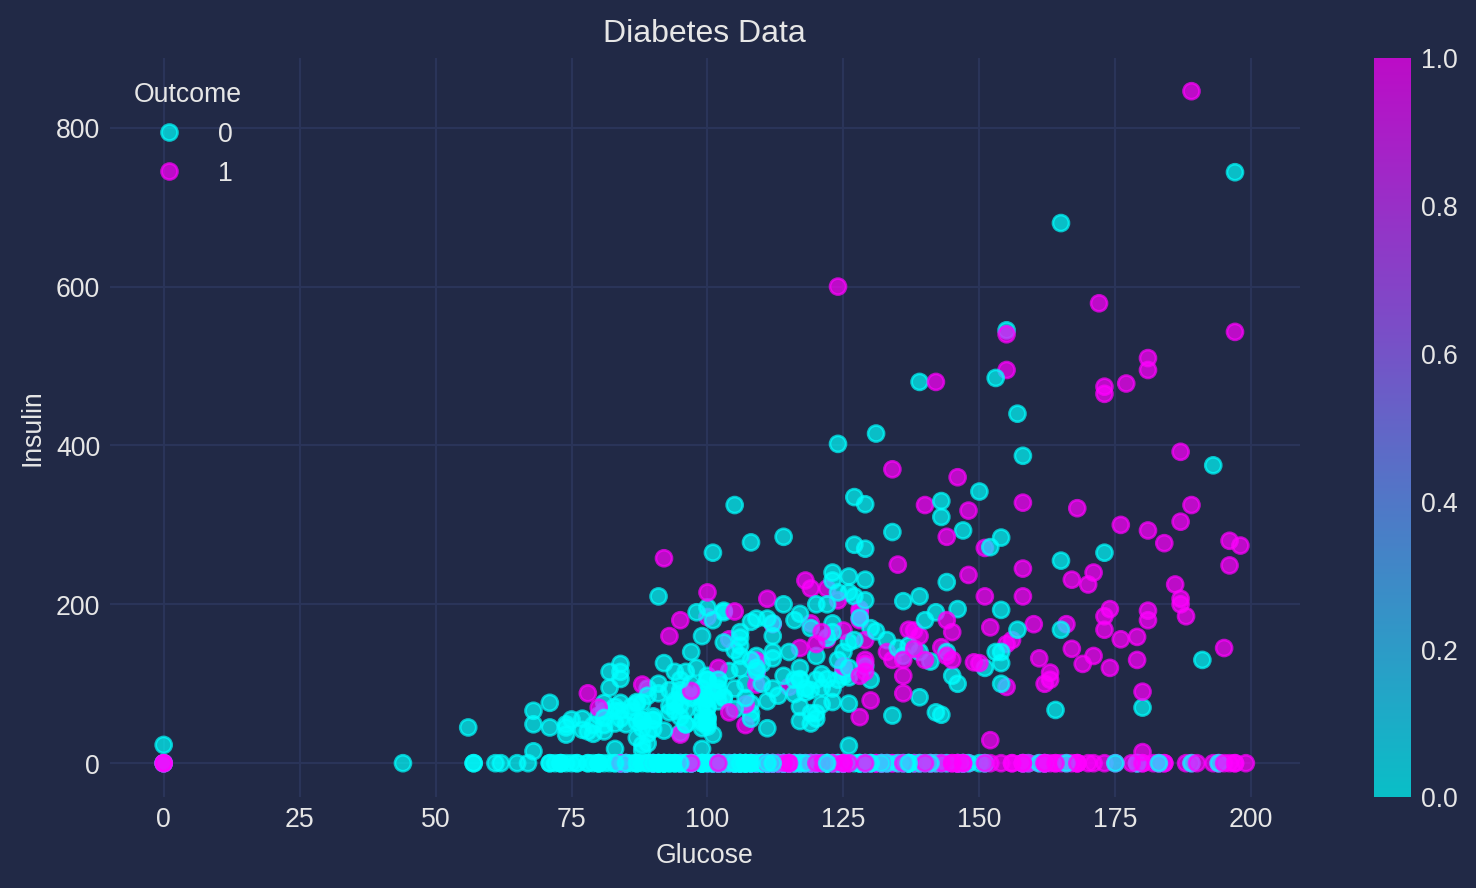
diebetes_data = pd.read_csv("../dataset/diabetes.csv")def plot_diabetes_data(diebetes_data, colormap=None):
"""
Plots diabetes data with a scatter plot.
"""
fig, ax = plt.subplots(figsize=(10, 5))
scatter = ax.scatter(
diebetes_data["Glucose"],
diebetes_data["Insulin"],
c=diebetes_data["Outcome"],
cmap=colormap,
alpha=0.7,
)
ax.set_xlabel("Glucose")
ax.set_ylabel("Insulin")
ax.set_title("Diabetes Data")
ax.legend(*scatter.legend_elements(), title="Outcome")
plt.colorbar(scatter)
return fig, ax
plot_diabetes_data(diebetes_data)
mplcyberpunk.add_glow_effects()
plt.show()